Training
Reading a single-engine climb chart
A worked interpolation and obstacle-gradient comparison, with the chart assumptions kept separate from the arithmetic.
FlyHdg360 · · 3 min read
Establish the chart conditions
Before following a line across a performance chart, identify what it represents. An all-engine climb chart cannot answer an engine-inoperative question. A rate-of-climb chart does not necessarily provide a climb gradient or a takeoff distance.
Read the conditions printed with the chart: aircraft weight, pressure altitude, temperature, power, airspeed, flap and gear position, and propeller state. Include any supplements that apply to installed equipment or modifications. Use the chart for the actual aircraft, not a remembered result from another twin.
Record the inputs and the resulting units. If the chart assumes a clean configuration and a feathered propeller, attach those assumptions to the result. A bare entry such as “200” cannot establish what performance was calculated or whether it applies to the planned phase of flight.
Source: FAA Airplane Flying Handbook, chapter 13: Multi-engine performance planning
A hypothetical interpolation
For an arithmetic example only, suppose a training table gives 240 ft/min at 20°C and 160 ft/min at 30°C, with all other inputs fixed. Assume the table instructions permit linear interpolation. At 25°C, the temperature is halfway between the two entries, so the interpolated result is 200 ft/min.
At 27°C, the fraction is (27 − 20) ÷ (30 − 20) = 0.7. The change across the interval is 160 − 240 = −80 ft/min. The result is 240 + 0.7 × (−80) = 184 ft/min. The negative sign matters: in this example, increasing temperature reduces the predicted climb rate.
These numbers are invented to demonstrate interpolation and must not be used as aircraft performance data. An actual chart may require a different sequence of steps or corrections. Do not extrapolate beyond its published range unless the approved instructions provide for doing so.
Source: FAA Airplane Flying Handbook, chapter 13; numerical example created by FlyHdg360
Translate the result into distance-based performance
Using the hypothetical 184 ft/min result and 110 knots groundspeed, the gradient is 184 × 60 ÷ 110, or approximately 100 ft/NM. This is the quantity to compare with a requirement expressed in feet per nautical mile.
Over three nautical miles at that constant gradient, the arithmetic height gain is approximately 300 feet. This simple calculation assumes the selected climb performance is already established and remains constant. It does not model the distance and altitude consumed during recognition, aircraft control, configuration changes, acceleration, or a turn.
A departure requiring 200 ft/NM would demand approximately 367 ft/min at 110 knots groundspeed. The hypothetical chart result does not meet that requirement. Rounding the predicted rate upward or selecting an unrelated chart cannot resolve the shortfall.
Source: FAA AIM 5-4-21: Gradient conversion; numerical example created by FlyHdg360
Separate a chart result from an operational decision
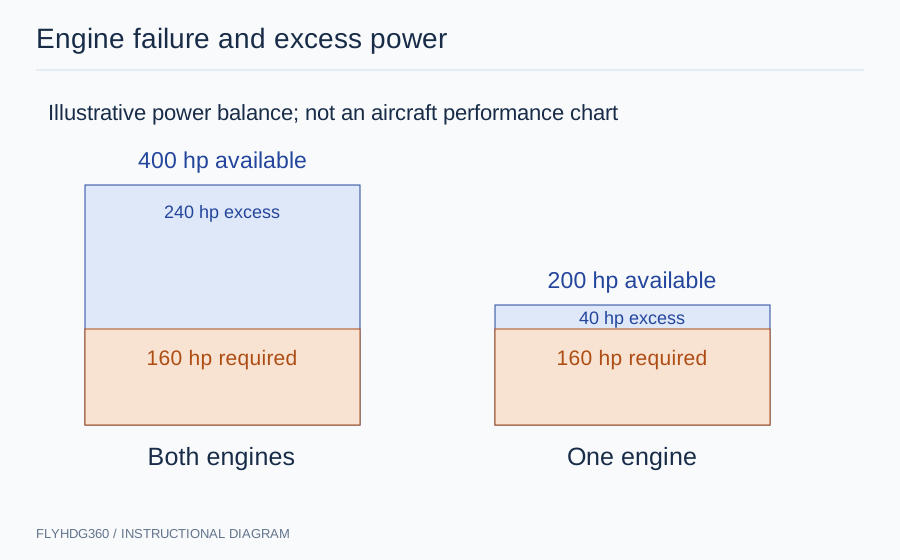
The chart is one input to the decision. The route, terrain, available landing areas, weather, runway, aircraft condition, and applicable operating requirements also matter. A small positive predicted climb rate should not be described as a guarantee of continued flight after an engine failure.
The initial response may occur in a configuration different from the chart’s steady-state assumptions. Procedures and training establish how the aircraft is controlled and configured; the graph does not supply that sequence. Avoid turning a study calculation into a generic engine-failure checklist.
A useful performance record includes the chart and revision, all inputs, configuration assumptions, interpolation steps, output units, and the comparison with the applicable requirement. If the resulting capability is inadequate, revise the operation rather than omitting an unfavorable input. Changes in loading, conditions, route, or aircraft need a new calculation using the appropriate data.
Source: FAA Airplane Flying Handbook, chapter 13: Performance limitations